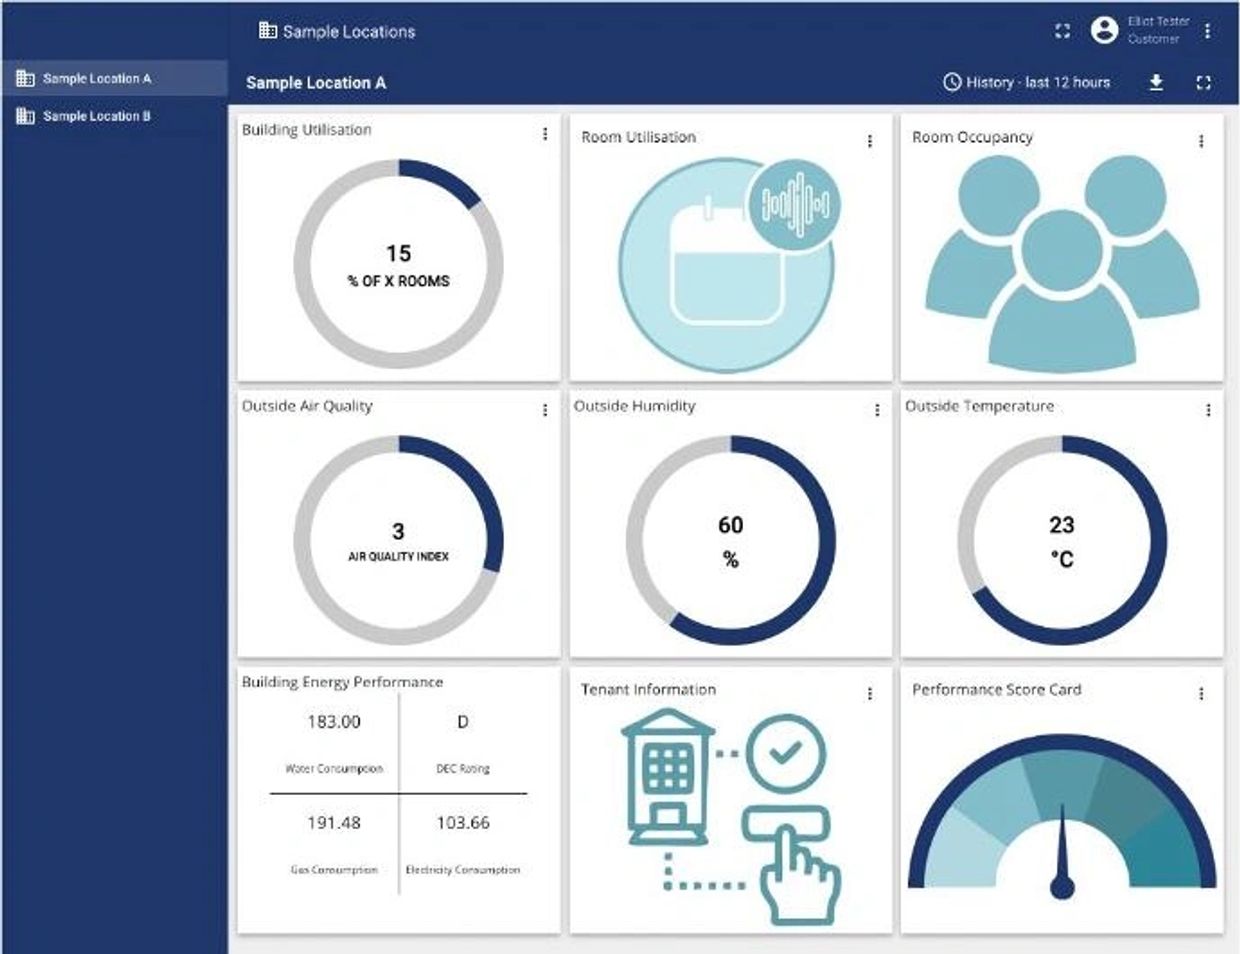
Energio Flow View
View is used to analyze and visualize the data being collected from the Engine and can run locally as well as in the cloud (or both).
The Dashboard in View allows users to view multiple sets of data on a customizable interface. Data from multiple systems and multiple sensor networks can not only be displayed but also configured in to custom reports.
The Engine can also distribute data to other visualization and control platforms such as Microsoft Azure, AWS, IBM Watson, Google Cloud or your own private server.
This website uses cookies.
We use cookies to analyze website traffic and optimize your website experience. By accepting our use of cookies, your data will be aggregated with all other user data.